Introduction
ONTAP has evolved from NetApp’s original operating system. It is most popular and widely-deployed operating system.
The different platforms that it can run on now are FAS, AFF, ONTAP Select, Cloud Volumes ONTAP, and NetApp Private Storage.
The different platforms run on hardware or virtual machine, and on premises or in the cloud.
NetApp ONTAP Architecture:
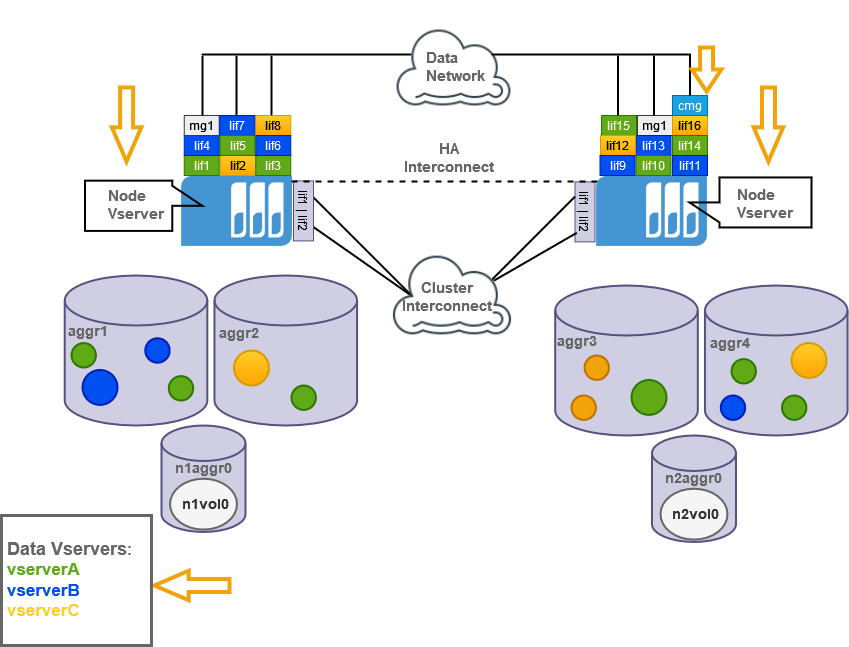
Cluster, Cluster Nodes and Disks
An ONTAP cluster can be as small as a single node cluster. Running a single node cluster means actually losing the access to data if the node fails. Simply it is not redundant.
To be redundant we can add another node to the existing cluster to form a HA-Pair. The two nodes which are connected in HA-Pair share a single disk. If we run a HA-Pair then we will have HA-Interconnect. This HA-Interconnect mirrors the NVRAM between these two nodes. So if one of the node fails then the other node can take over the aggregates of the failed node. Thus, there will be no loss of data even if one of the node fails. We have a network called Cluster Interconnect. The Cluster Interconnect is used for heartbeat configuration management and volume data between the cluster nodes.
A cluster node can be scaled out by connecting one or more HA-Pairs to the same cluster. Each HA-pair should be connected to Cluster Interconnect and each HA-pair contains individual HA_Interconnect.
Based on the protocols we use the maximum number of HA-Pairs and can be configured as follows:
- NAS : 12 HA-Pairs (24 Nodes)
- SAN : 6 HA-Pairs (12 Nodes)
Aggregates, Volumes and SVMs
Client data and configuration data in ONTAP is stored in volumes, and volumes are always a part of an aggregate. Aggregate is a collection of disks. Each node contains only one root aggregate, but we can have multiple data aggregates per node. In the case of node failure the surviving node will take over the aggregates of the failed node by default. In case of single HA-Pair the aggregates will be given back automatically after the failed node is up and running again.
There is a very important volume called root volume typically named as vol0, which is located in root aggregate. This volume is a node volume which contains cluster configurations and log files. So every node contains a volume named vol0.
A cluster always runs virtual machines. SVMs are logical representation of one of four types. They are:
System Type (Cluster SVM) : We have only one such type of SVM in the cluster. This SVM is used to manage the cluster Inter-Connect interfaces.
Node Type (Node SVM) : Each node in the cluster is represented as a node SVM.
Admin Type (Cluster Management SVM) : Usually connect to this type of SVM when we want to manage the cluster. Basically it represents the cluster.
Data Type : Depending on the number of nodes and protocols we use we can have upto a maximum of 1000 SVMs of this type. These type of SVMs are used to represent data towards our NAS and SAN clients. The data of the SVMs is stored in volumes. All the volumes belonging to a particular data SVM are a part of namespace of that particular SVM. Therefore, the namespace of a data SVM contains all of its data volumes. A data SVM contains exactly one root volume. This is a very small volume of 1GB commonly used to manage data volumes. This root volume should never contain data and the only information available from the root volume is junction paths of the connected data volumes. In a NAS environment the volumes have to be managed, otherwise they are not accessible by the clients.
LUNs and QTrees
A LUN is the logical representation of storage in a storage area network (SAN). In ONTAP, a LUN is located within a volume. Optionally, it can be located within a Qtree in a volume.
A Qtree is a logically defined file system that can exist as a special subdirectory of the root directory within a FlexVol volume or a FlexGroup volume.
Key Use Cases
Discovery Use Cases:
- Provides resource visibility to the administrator to view and manage resources available (Ex: Cluster, Nodes, Disks, Aggregates, Volumes, Luns and QTrees) under different resource types.
- Publishes relationships between resources to have a topological view and ease of maintenance.
Monitoring Use Cases:
- Provides metrics related to Memory Utilization, Performance Utilization and so on for different resources.
- Concern alerts will be generated for each metric to notify the administrator regarding the issue with the resource.
Hierarchy of NetApp ONTAP
NetApp Cluster
NetApp Cluster Node
NetApp Storage Aggregate
NetApp Storage Port
NetApp Storage Ethernet Port
NetApp Storage LIF Interface
NetApp Storage FC Port
NetApp Storage FC Interface
NetApp Storage Disk
NetApp Storage Shelf
NetApp Storage SVM
NetApp Storage Volume
NetApp Storage Lun
NetApp Storage Qtree
NetApp Remote Cluster
NetApp Remote Cluster Node
Supported Target Version
| Supported Target Versions |
|---|
| Target device version 9.8 |
| REST API version using 9.8 |
Version History
| Application Version | Bug fixes / Enhancements |
|---|---|
| 7.0.3 | Fixed LUN Relationship issue. |
| 7.0.2 | Removed Custom Attribute Services for NativeType NetApp Storage LIF Interface.Note: Resources that include the Services attribute will retain this attribute after the upgrade; it will not be deleted. |
| 7.0.1 | Resolved Node Discovery issue. |
| 7.0.0 |
|
| 6.0.1 | Provided fix for Get Latest Metrics, Activity Logger and DebugHandler Changes |
| 6.0.0 | Additional support fot NetApp Snapvault monitoring |
| 5.0.0 | Provided additional metric support on Disk, Node, SVM, Volume and Qtree native type. |
| 4.0.3 | Provided a fix for resource cleaned up. |
Click here to view the earlier version updates
| Application Version | Bug fixes / Enhancements |
|---|---|
| 4.0.2 | Metric evaluation changes for some bytes to GB conversion metrics |
| 4.0.2 | Metric evaluation changes for some bytes to GB conversion metrics |
| 4.0.1 |
|
| 4.0.0 |
|
| 3.0.2 |
|
| 3.0.1 |
|
| 3.0.0 |
|
| 2.0.0 |
|
| 1.0.2 |
|
| 1.0.1 |
|
- See, Working with NetApp ONTAP for more information on how to configure NetApp ONTAP.
- See Supported Metrics and Default Monitoring Configuration for more information about Supported Metrics and Default Monitoring Configuration of NetApp ONTAP.
- See Supported Alert and Resource Filter Input keys for more information about Supported Alert and Resource Filter Input keys of NetApp ONTAP.
- See Risk, Limitations and Assumptions for more information about the Risk, Limitations and Assumptions of NetApp ONTAP.