Introduction
The View Monitoring Configuration option on the METRICS tab allows you to perform the following:
- Configure availability rule
- View monitored metrics
- Customize Metric Thresholds
- Configure resource-level and component-level thresholds
- Assign/un-assign templates to a resource
- Get latest metric values
- Get Latest Snapshot
- Remove template
You can access this option in the METRICS tab by clicking the gear icon to the right corner of the screen, as shown in the following image:

Configure the availability rule
When you apply a template, the first option ALL is selected by default, but you can change it to ANY if you prefer.

The Availability rule applies to the resources with more than one Availability metric. If you have only one availability metric, then the ALL/ANY rule does not apply.
Availability calculation is divided into two parts:
- ALL: This option means, if all the Availability metrics do not have any critical alert, then the resource is considered UP (OK). If any of the Availability metrics has a critical alert, then the resource is considered as DOWN.
- ANY: This option means, if any of the Availability metrics do not have a critical alert, then the resource is considered as UP (OK). If all the Availability metrics have a critical alert, then the resource is considered as DOWN.
View monitored metrics
The Monitored Metrics section displays a list of all the metrics assigned to a template.

The following table describes the fields in the Monitored Metric section:
| Field | Description |
|---|---|
| Name | Name of the metric. |
| Template Name | Name of the template. |
| Frequency | Polling interval of the metric. |
| Warning Expression | An expression formed with the combination of Operator, Threshold and Repeat count, defined when creating a template and is used to generate warning alert. |
| Critical Expression | An expression formed with the combination of operator, threshold and repeat count, defined when creating a template and is used to generate critical alert. |
| Alert | Generate alert for this metric based on the configured threshold. |
| Availability | Represents if the metric is selected as availability metric. |
| Last Monitored | The last time the metric data was collected for monitoring. |
Customize Metric Thresholds
This section explains why and how you can customize metric thresholds for specific resources in OpsRamp, even after assigning the monitoring template to the resource. to multiple resources.
Why Customize Metric Thresholds per Resource?
You might need to customize metric thresholds at the resource level in various scenarios:
Scenario 1: Suppressing Noise on Specific Resource
Consider a scenario where a monitoring template, containing predefined thresholds for various metrics, has been applied to a significant number of resources via a Device Management Policy or bulk assignment. However, you might notice that a particular resource or a small set of resources are frequently generating alerts for a specific metric, even though their behavior is within an acceptable range.
In such cases, rather than modifying the template and potentially affecting the alerting behavior of all associated resources, you can use resource-level threshold customization for the specific resource. This localized adjustment controls the excessive alert generation (“noise”) without altering the monitoring configuration of other resources.
Scenario 2: Adjusting Thresholds for Critical Resources
Consider a deployment scenario where a monitoring template with standardized thresholds (e.g., Warning at 80%, Critical at 90%) for a specific metric is applied across the environment. However, you have a specific resources that is exceptionally critical to your operations. Even reaching the standard warning threshold on this resource could indicate a potential issue that requires immediate attention.
In these situations, it may be necessary to implement a reduction in the warning and critical thresholds specifically for this resource (e.g., Warning at 50%, Critical at 60%). This targeted configuration ensures that you receive alerts earlier for this critical resource, allowing you to proactively address potential problems before they escalate, even if the standard thresholds are appropriate for the rest of your infrastructure.
Thus, by customizing metric thresholds at the resource level, you gain granular control over your monitoring, ensuring that you receive relevant and timely alerts for all your resources, while minimizing unnecessary noise and proactively managing critical systems.
You can customize metrics for the following:
Metrics in the Legacy Monitoring templates that need to be customized differently, list follows:
Agent based monitors
- Windows Service monitor
- Windows Event Log monitor
- Process Monitor
- Custom Monitor
- Application Monitor
- Performance Monitor
- Other Monitor
Public Cloud Monitors
See List of Legacy Metrics for Customization for more information.
Latest metrics, all the other metrics that don’t fall under the above category, will follow the following hierarchy while doing the metric-level customization i.e., Template level, Template-component level, Resource level, and Component level.
Configure resource-level and component-level thresholds
- Resource-level thresholds: You can customize the resource thresholds which are specific to a resource being monitored. This allows for precise control over the performance of the resource and ensures the alerts are triggered at the appropriate levels. This helps you to manage resources effectively.
- Component-level thresholds: Configure component thresholds of a resource to receive notifications when a certain level or limit has exceeded. Resource components can include monitoring, for example - Specific disk partirition of a Server, CPU cores, Memory free/virtual/boot, Specific interface of a network switch, Power Supply unit, specific instance of a FAN on the Hypervisor.
The following section describes the steps to customize thresholds for the latest metrics:
- In the MONITORED METRICS section, click the edit icon next to a template. The Template window is displayed.
- Select RESOURCE and/or COMPONENT checkboxes, as per your requirements to customize your template.

- Enter the following information:
Field Name Field Type Description Component Name (or Location for synthetics only) String This option is displayed for COMPONENT. Enter the component name. Example: CPU, Memory, Disk. Alert Checkbox Select the checkbox if you prefer receiving alerts if threshold is breached. Warning Threshold Dropdown Select the operator to compare the warning threshold value. Enter the warning threshold value. Warning Repeat Count Dropdown Number of times the alert threshold condition breaches before generating an alert. Critical Threshold Dropdown Select the operator to compare the critical threshold value. Enter the critical threshold value. Critical Repeat Count Dropdown Number of times the alert threshold condition breaches before generating an alert. - Click Save. The metric details are saved and is available in the list of metrics.
The following table displays the priority with which the resource thresholds are applied.
Field Description Template level 4 Template Component level 3 Resource level 2 Component level 1
Note
Unassigning/Re-assigning of a metric on the resource is not possible in the current design. This was available in the legacy UI. So when you see an Agent based G1 metrics or Public cloud G1 metrics the option to unassing/re-assign a specific metric on a resource is not supported in the new UI. However, you can disable the alerting on the metric as per your requirement.Now you know how to enable threshold customization at the resource level and the resource component level.
Template and Resource Level Metric Customization Combinations
The following section details all the combinations of resource-level metric customization available in OpsRamp. We have used the metric system.memory.usage.utilization as an example.

In this example, the memory usage utilization metric has three components: Physical, Virtual, and Cache. Throughout the examples in the following table, these three components are used for various combinations.
(Scroll the table horizontally to see all columns.)
| S.No | Combination | Details | Template Threshold | Template Component Threshold | Resource Threshold | Component Threshold | Result |
|---|---|---|---|---|---|---|---|
| 1 | Template Threshold and Template Component Threshold | Configured Physical as a component in the Template Component Threshold. | Yes | Yes | No | No | Template Component Threshold takes precedence for the Physical component. For the remaining components, Template Thresholds are applied. |
| 2 | Template Threshold and Resource Threshold | Resource Threshold is configured. | Yes | No | Yes | No | Resource Threshold takes precedence for all components. |
| 3 | Template Threshold and Component Threshold | Configured Virtual as a component in the Component Threshold. | Yes | No | No | Yes | Component Thresholds configured for the Virtual component take precedence. For the remaining components, Template Thresholds are applied. |
| 4 | Template Threshold, Template Component Threshold, and Resource Threshold | Configured Physical as a component in the Template Component Threshold, and Resource Threshold is configured. | Yes | Yes | Yes | No | Only Resource Threshold takes precedence. Template Threshold and Template Component Threshold are ignored. |
| 5 | Template Threshold, Template Component Threshold, and Component Threshold | Configured Physical as a component in the Template Component Threshold and Virtual as a component in the Component Threshold. | Yes | Yes | No | Yes | Component Thresholds apply to the Virtual component. Template Component Threshold applies to the Physical component. Components not mentioned in Template Component Threshold use Template Thresholds. |
| 6 | Template Threshold, Resource Threshold, and Component Threshold | Configured Virtual as a component in the Component Threshold. | Yes | No | Yes | Yes | Component Thresholds apply to the Virtual component. Resource Threshold applies to the Physical and Cache components. |
| 7 | Template Threshold, Template Component Threshold, Resource Threshold, and Component Threshold | Configured Physical as a component in the Template Component Threshold and Virtual as a component in the Component Threshold. | Yes | Yes | Yes | Yes | Component Thresholds apply to the Virtual component. Resource Threshold applies to the Physical and Cache components. |
Note
Whenever the Resource Threshold checkbox is enabled, Template Threshold and Template Component Threshold are ignored.Reverting to template-level thresholds from resource-level thresholds
To revert metric thresholds from resource-level customizations back to the template-level:
- Click on the edit icon on the metric in the Monitored Metrics tab.
- Clear the resource level or resource component level checkbox in the pop-up window to switch back to the template-level or template component-level thresholds.
The above process works only for the following metrics:
- Agent-based metrics from G1 monitoring templates
- Application Monitor
- Performance Monitor
- Public Cloud metrics from G1 monitoring templates
- All the latest metrics from the G2 monitoring templates.
Limitation
For the metrics mentioned in this section, reverting to template-level thresholds requires a different procedure, as a simple deselection of the checkbox is not supported.
To revert from resource-level thresholds to template-level thresholds customization for these metrics:
- Unassign the specific metric in the pop-up window.
- Unassign the entire monitoring template from the resource.
- Reassign the template on the resource to go back to the Template level thresholds.
The following monitoring templates do not support a single-click reversion to template-level thresholds:
Agent-based metrics from G1 monitoring templates
- Windows Service monitor
- Windows Event Log monitor
- Process Monitor
- Custom Monitor
- Other Monitor

Assign/un-assign templates to a resource
The Assigned Templates section displays a list of templates that are assigned to a resource and allows you to assign a new template or un-assign an exiting template.

The following tables describes each field of the Assigned Templates section:
| Field | Description |
|---|---|
| Template Name | Name of the template. For example, G2 MSSQL Database Transactions Time Template. |
| Description | The summary of the template. |
| Collector Type | The collector that you want to use to gather metric data. Example: Agent, Gateway, Azure, etc. |
| Generation | Generation that the template belongs to. For example, Generation G1/G2. |
| Parameters | The configuration parameters applied on the resource. You can click Edit and update these parameters. |
| Filters | The selective fields of a component that you want to monitor. |
| Applied Time | The last time the template was applied to the resource. |
Assign templates
Follow these steps to assign a template:
- In the ASSIGNED TEMPLATES section, click + ASSIGN TEMPLATES. The ASSIGN MONITORING TEMPLATES window is displayed.
- Use the search icon to search for templates you want to apply. You can also use the Filter option to filter templates.
- Select the templates and click ASSIGN TEMPLATE.
Note
Based on the template selected, you will have to provide the configuration parameters. The configuration parameter window is displayed. - Enter the information in the fields.
- Click SAVE. The template is applied and the status is displayed.
Un-assign templates
You can un-assign more than one template at a time. To un-assign a template:
- In the ASSIGNED TEMPLATES section, select checkbox for the templates you want to un-assign.

- Click UNASSIGN. The following dialog is displayed.

3. Select the checkbox if you want to remove the graphs associated with the templates.
4. Click CONFIRM. The selected template is now un-assigned.
Get Latest Metric Values
The Get Latest Metric Values option allows you to retrieve the latest metric data for the resource. Data is displayed in a tabular format with Component Name, Metric Name, Metric Value, and State columns. It also shows the date and time data is collected.
This helps you to quickly check the current performance or status of a resource without waiting for the next scheduled metric update.
To view latest metric values:
Click the three dots icon next to the template.

Select Get Latest Metric Values. The LAST METRIC VALUES popup window is displayed.

Get Latest Snapshot
The Get Latest Snapshot option allows you to fetch the latest snapshot for the resource. Data is displayed in a tabular format with Monitor Name, State, and Result columns. It also shows the date and time data is collected.
This helps you to quickly check the current state of a resource with its components, without waiting for the next scheduled metric update. It allows you to take appropriate steps to address the issue to ensure optimal performance of the resource.
To view latest snapshot:
Click the three dots icon next to the template.
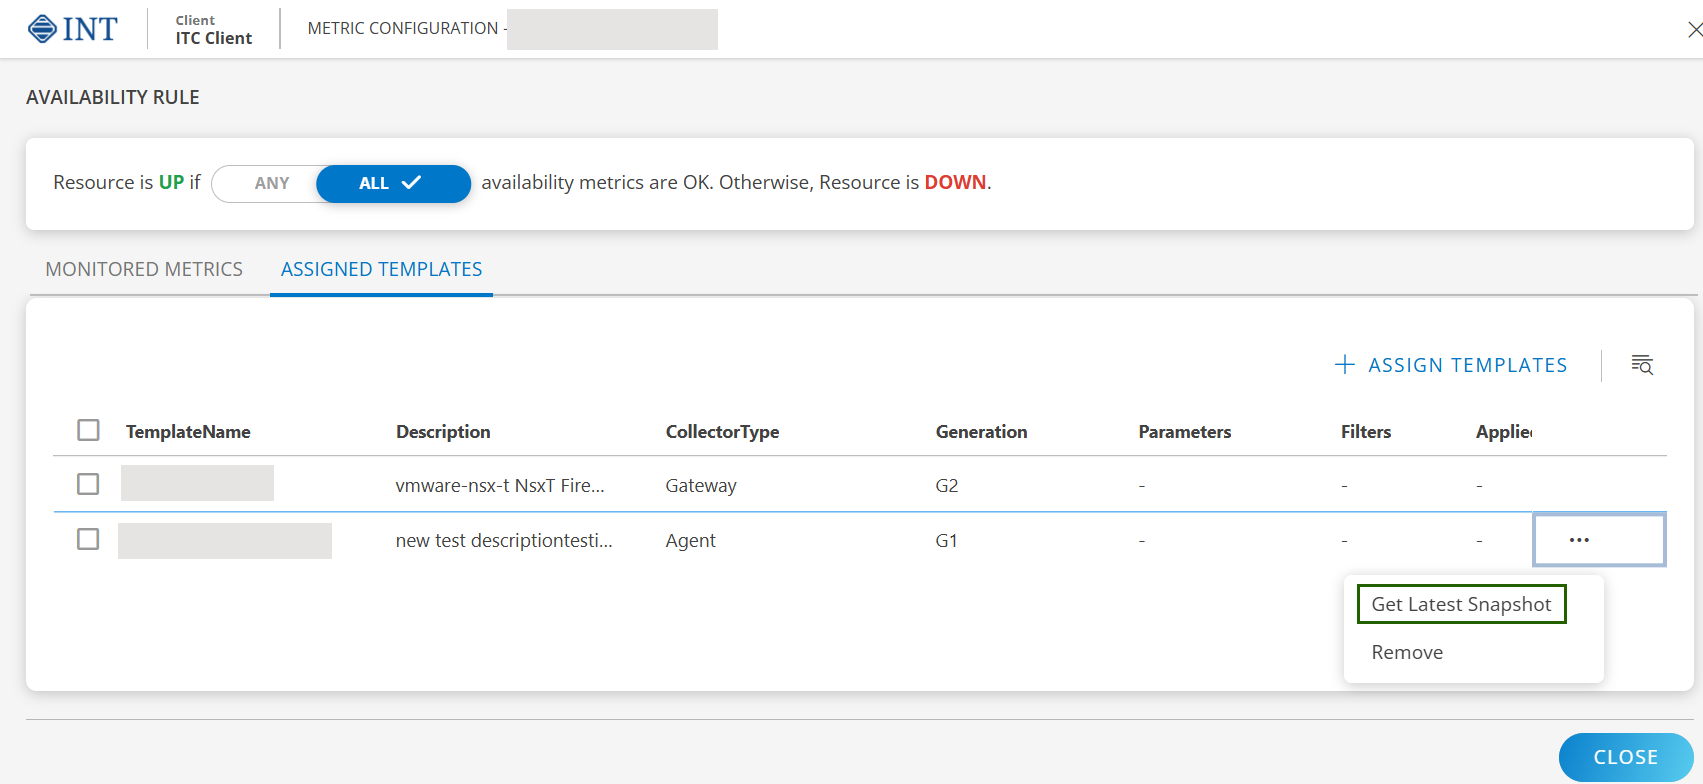
Select Get Latest Snapshot. The LAST SNAPSHOT popup window is displayed.

Remove template
You can remove only one template at a time. To remove a template:
- In the Resource details screen, click METRICS tab.
- Click TEMPLATES. The TEMPLATES screen is displayed.
- In ASSIGNED TEMPLATES section, search for the template you want to delete.
- Click the three dots icon next to the template.

- Select Remove.A confirmation dialog is displayed.
- Select the checkbox if you want to remove the graphs associated with the templates.
- Click CONFIRM. The selected template will be removed.